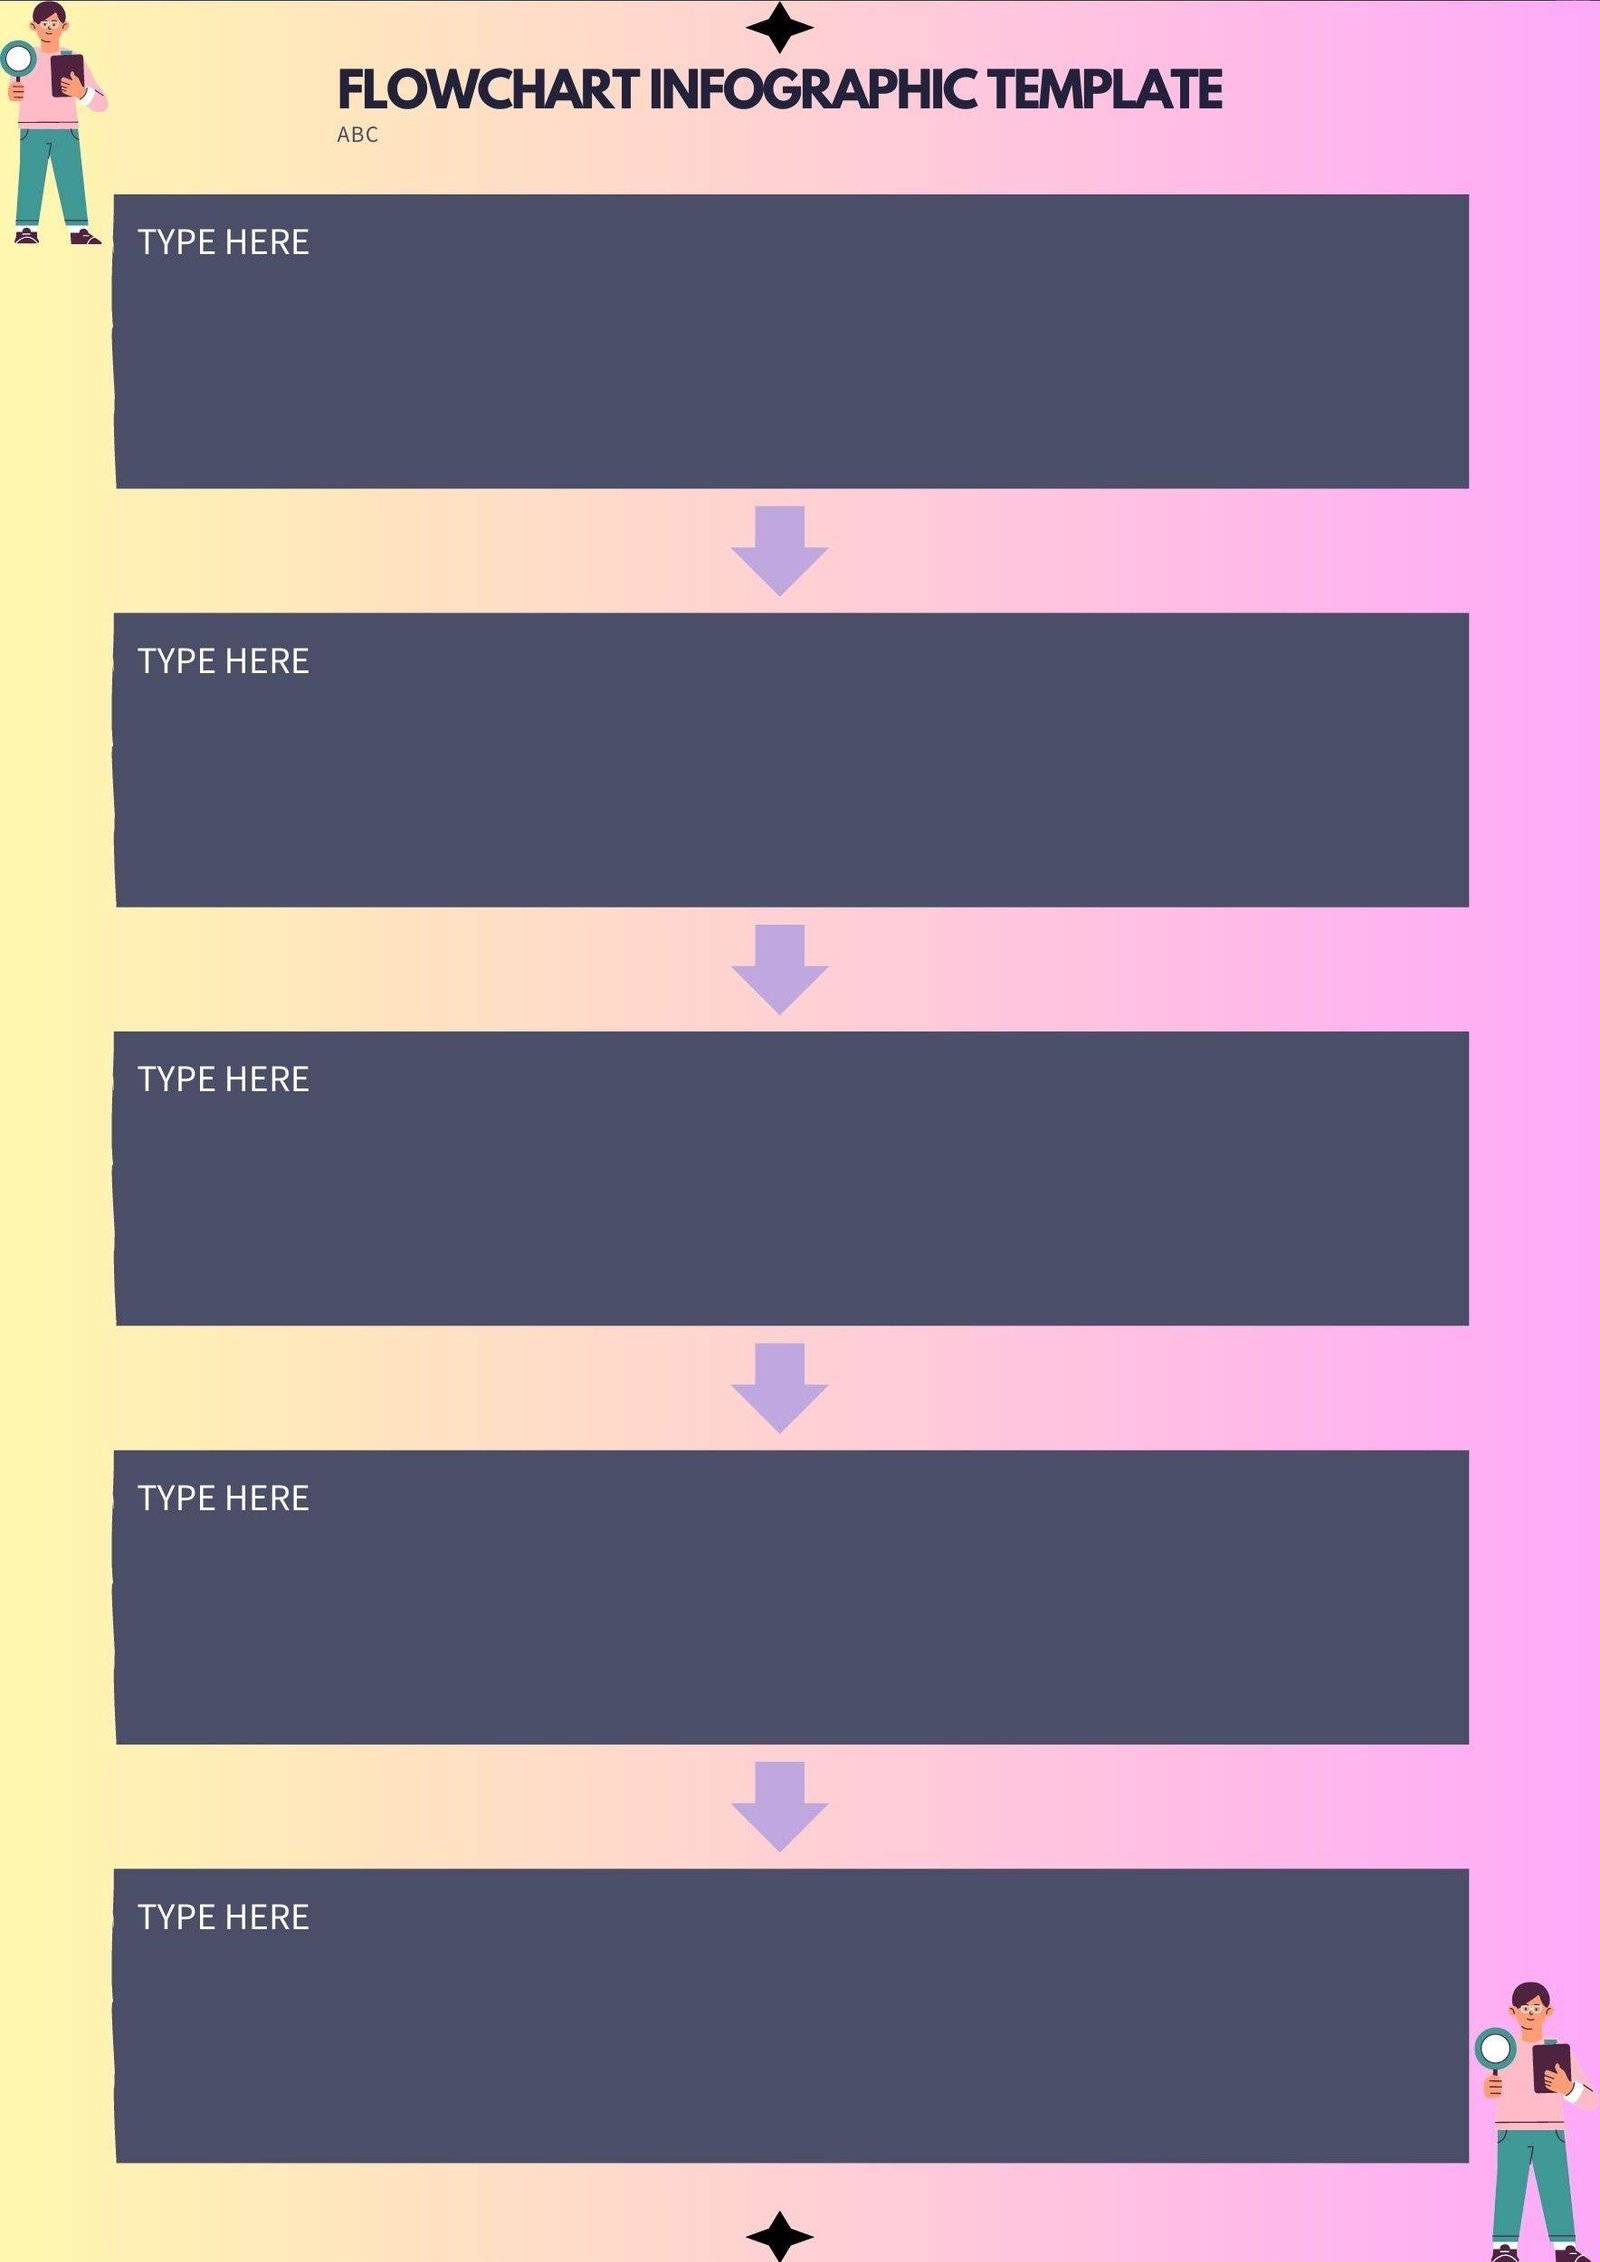
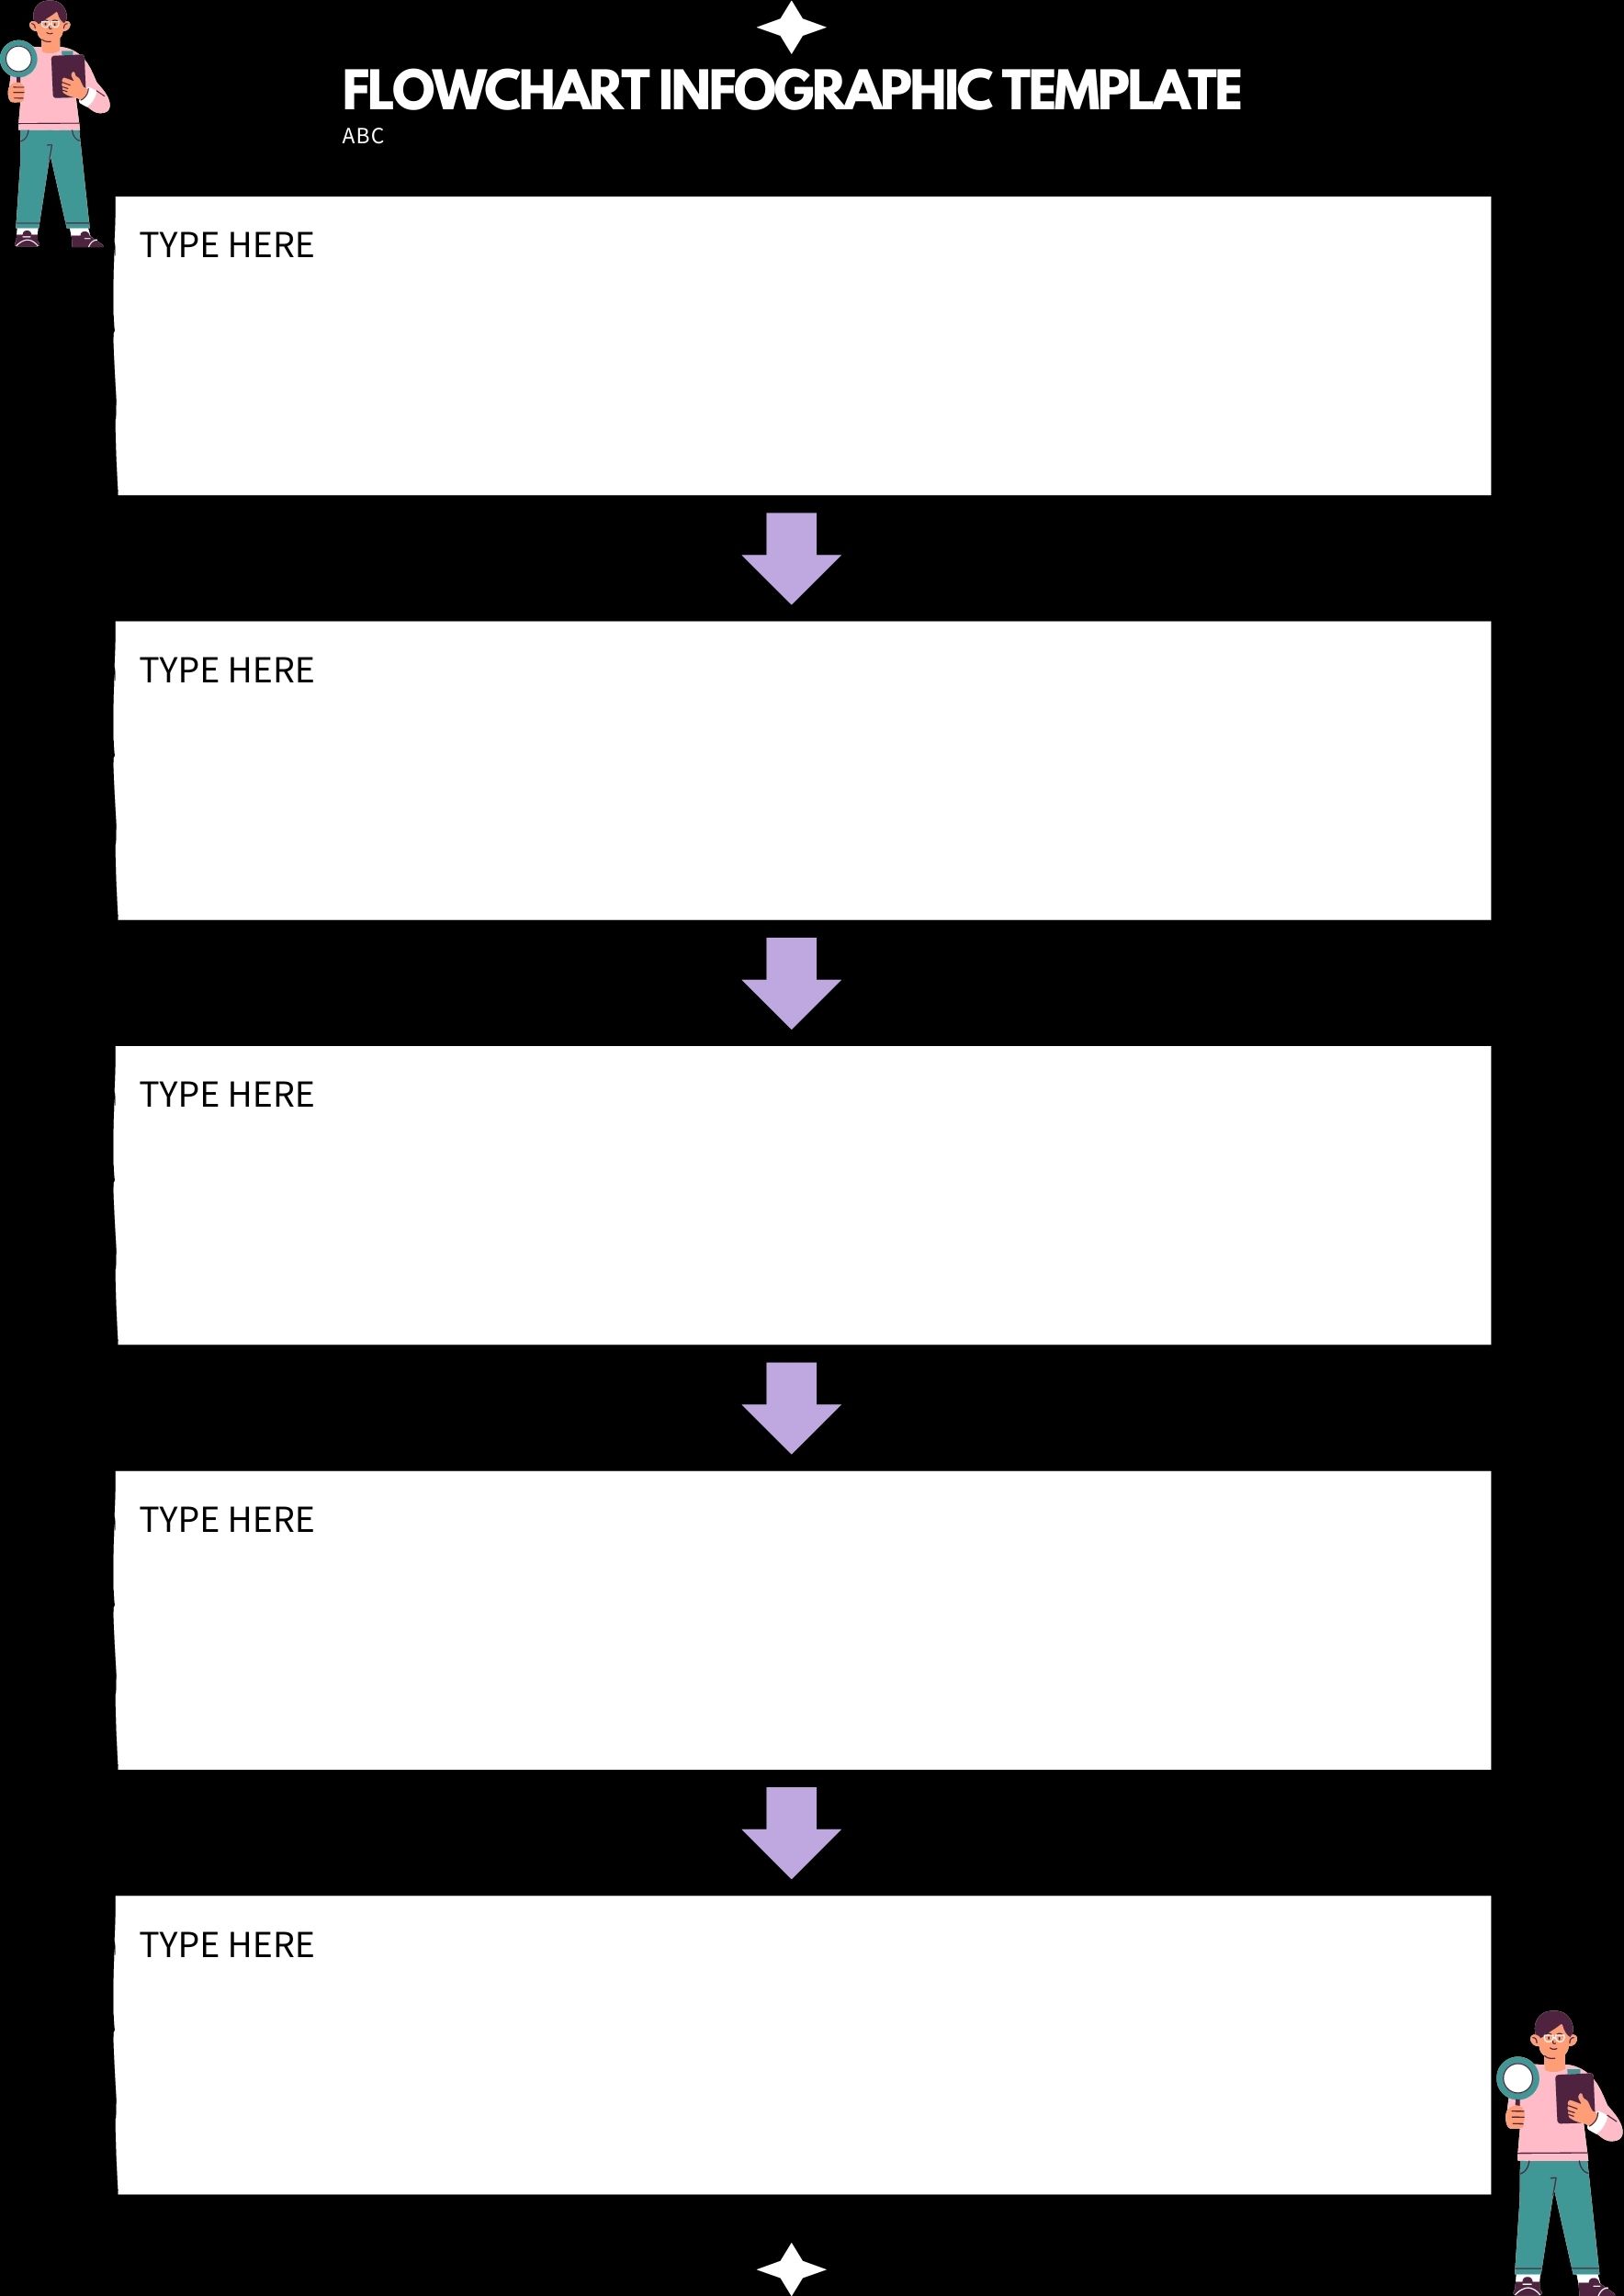
Lets us explain flowchart infographic


A flowchart infographic is a visual representation of a process or workflow. It uses a combination of shapes, arrows, and text to show the steps involved in a process.
They can be used to communicate complex information in a clear and concise way. They can also be used to help people understand how different parts of a process fit together.
Here are some of the benefits of using these infographics:
- They can help you communicate complex information in a clear and concise way.
- They can help people understand how different parts of a process fit together.
- They can help you identify potential problems or bottlenecks in your process.
- They can help you improve your process by making it more efficient or effective.
If you’re new to creating flowchart infographics, here are a few tips to help you get started:
- Start by identifying the process or workflow that you want to represent.
- Break the process down into smaller steps.
- Use different shapes and arrows to represent different types of steps.
- Use text to label the steps and to provide additional information.
- Use colors and fonts to make your infographic visually appealing.
Here are some examples of flowchart infographics:
- A flowchart template that shows the steps involved in creating a website.
- A flowchart template that shows the steps involved in customer service.
- A flowchart template that shows the steps involved in the manufacturing process.
It can be used in a variety of different contexts, including:
- Business presentations
- Employee training materials
- Product documentation
- Marketing materials
- Educational materials
If you’re looking for a way to communicate complex information in a clear and concise way, consider using a flowchart infographic. And you can also try our templates. You can also access more free templates from our canvainfographic.com
More Related Topics:
Sign up to get free tips and templates.
