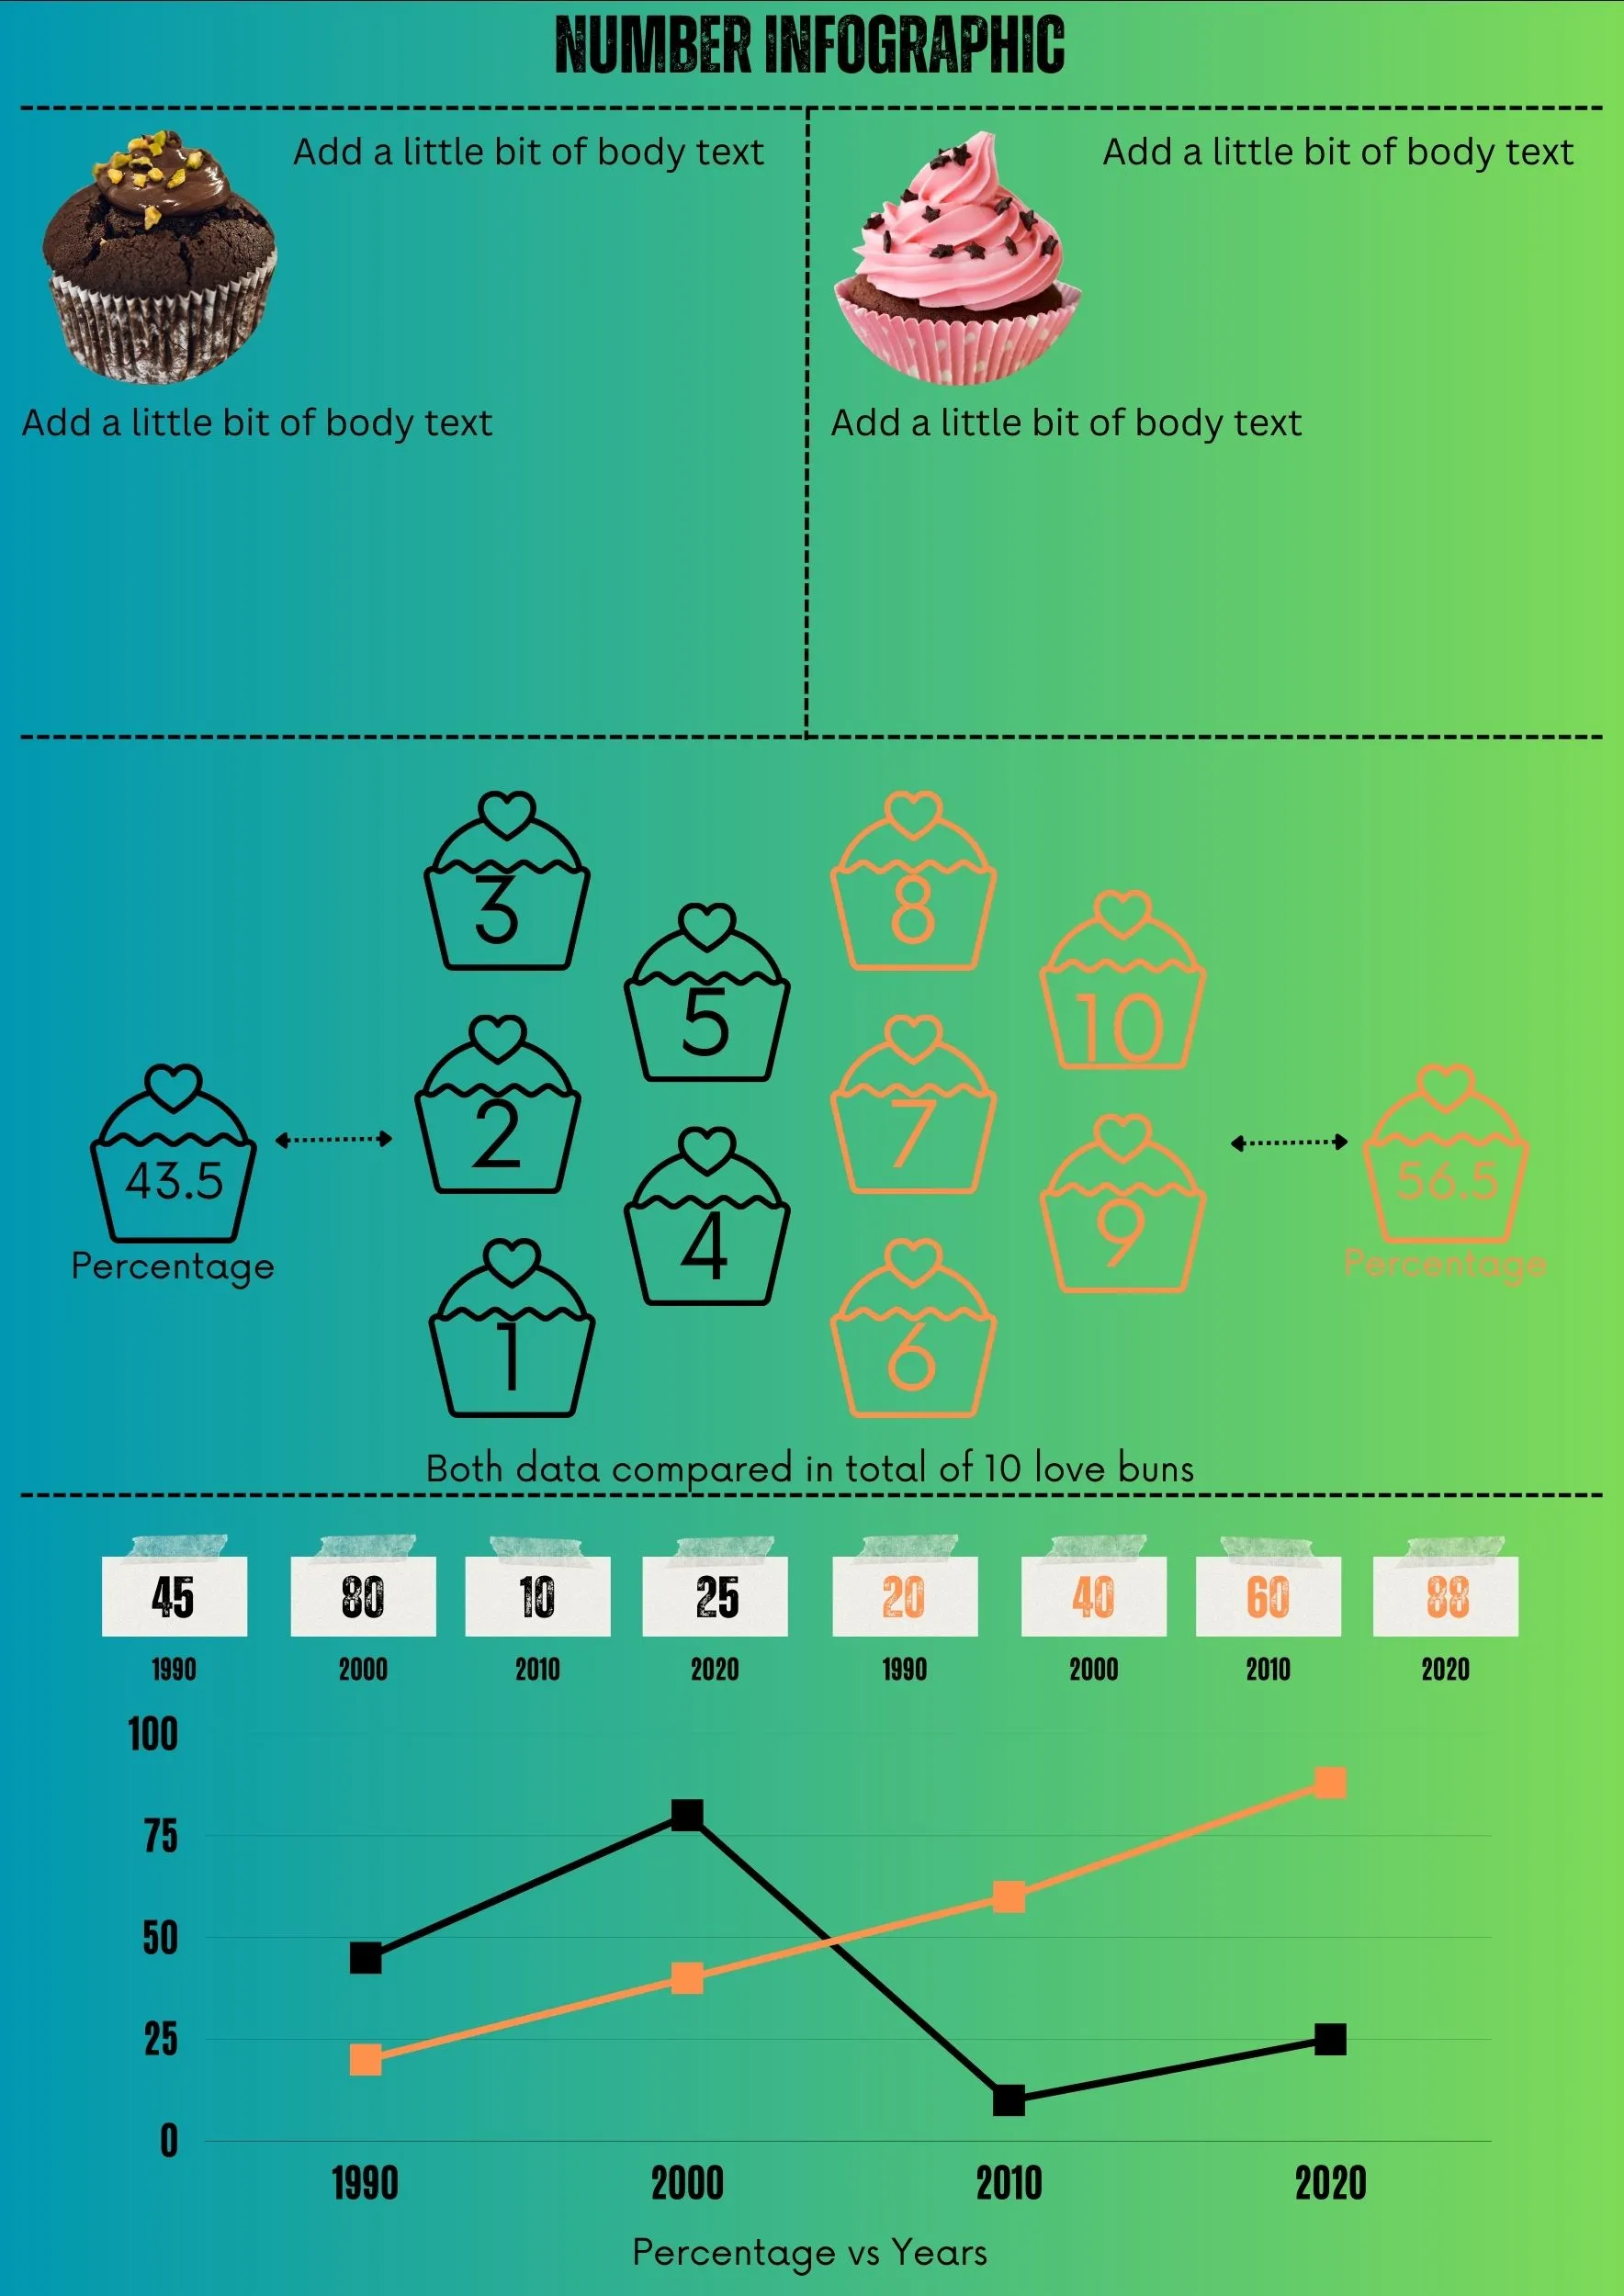
Let us explain numbers infographic.


An infographic is a visual representation of information or data that uses graphics, charts, and other visual elements to make the information easier to understand.
Numbers infographics are a type of infographic that focuses on data and statistics.
They are often used to communicate complex information in a clear and concise way.
Here are some tips for creating a numbers infographic for newbies:
- Choose the right data. Not all data is created equal. When choosing data for your infographic, make sure it is relevant, interesting, and easy to understand.
- Use clear and concise language. When writing the text for your infographic, use simple language that is easy to read and understand. Avoid using jargon or technical terms that your audience may not understand.
- Use visuals to tell the story. Infographics are all about visuals. Use charts, graphs, and other visuals to help tell the story of your data.
- Keep it simple. Infographics should be easy to read and understand. Don’t overload your infographic with too much information or too many visuals.
- Proofread your work. Before you publish your infographic, be sure to proofread it carefully for any errors.
Here are some examples of numbers infographics:
- A chart that shows the growth of a company’s sales over time.
- A graph that shows the relationship between two variables.
- A map that shows the distribution of a population.
- A table that lists the top ten cities in the world by population.
Numbers infographics can be used for a variety of purposes, including:
- Education: Infographics can be used to educate people about a particular topic.
- Marketing: Infographics can be used to market a product or service.
- Communication: Infographics can be used to communicate information to a large audience.
- Persuasion: Infographics can be used to persuade people to take a particular action.
If you are new to creating infographics, there are a number of resources available to help you get started. There are many online tutorials that can teach you the basics of infographic design. There are also a number of software programs that can help you create infographics.
With a little effort, you can create these infographics that are both informative and engaging. You can also access more free templates from our canvainfographic.com
More Related Topics:
Sign up to get free tips and templates.
